Statewide :: News & Press :: Interactive Map :: Map Poster :: About the Map :: Landsat Lake Images
Spectral Signatures of Two Madison Lakes
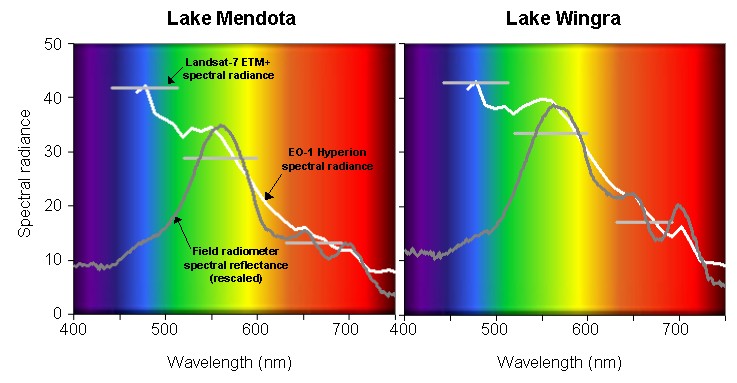
| These two figures compare the spectral response of Lake Mendota and Lake Wingra, and illustrate how the lakes' spectral "signatures" vary when observed using different types of sensors. On September 2, 2001, two satellite systems collected imagery of the Madison lakes from space, while University of Wisconsin researchers simultaneously acquired field measurements from boats on the lakes. The two satellite systems were the Hyperion imaging spectrometer carried on NASA's EO-1 satellite, and the Landsat-7 Enhanced Thematic Mapper Plus (ETM+). Each of these remote sensing systems measured the spectral radiance, or amount of light reflected from each lake's surface at different wavelengths of the electromagnetic spectrum. The direct measurements made from the boats were conducted using a hand-held field spectroradiometer, which measures reflected light at the lake's surface. The two plots show these measurements as a function of the wavelength of light, across the the visible part of the spectrum from 400 nanometers (nm) (ultraviolet) to 750 nm (near-infrared). The white line on each lake's plot shows the spectral radiance measured by EO-1 Hyperion at each of 28 wavelengths. Hyperion collects data in many narrow, contiguous spectral bands; this type of sensor is referred to as a "hyperspectral" system. The three straight, light gray lines show the spectral radiance measured by Landsat-7 ETM+. In the visible part of the spectrum, ETM+ measures spectral radiance in three broad bands, 450 to 520 nm (blue light), 520 to 600 nm (green light), and 630 to 690 nm (red light). Within each of these bands, ETM+ integrates the spectral reflectance at all wavelengths to produce a single "average" value; thus, it provides a much less detailed spectral signature than that measured by Hyperion. The continuous dark gray line on each plot shows the spectral signature of each lake, as measured from a boat using a hand-held spectroradiometer. In this range (400 to 750 nm) the spectroradiometer measures radiance in 220 very narrow wavelength bands. For these figures, the data recorded by the spectroradiometer have been rescaled to permit comparison with the spectral radiance measurements from the satellite systems. The astute observer will note many interesting things in these two figures:
Clearly, a hyperspectral system that measures radiance at dozens of wavelengths in the visible spectrum provides more detailed data than a traditional "multispectral" system, which averages those wavelengths into three broad spectral bands. However, there are tradeoffs: multispectral sensors such as those carried by the Landsat satellites have been operational for three decades, and they provide regular coverage over large areas - Landsat-7 covers a 185-kilometer-wide swath in a single image, and covers the entire conterminous US every 16 days. In contrast, the first hyperspectral satellite system (Hyperion) was launched only recently (November, 2000); it covers only a very narrow swath (7.5 kilometers wide) and will never collect data over most areas. Both hyperspectral systems, such as EO-1 Hyperion, and multispectral systems, such as Landsat-7 ETM+, can provide useful information about lakes and their environments, and the two types of systems should be seen as complementary tools for lake managers and scientists. |
