Statewide :: News & Press :: Interactive Map :: Map Poster :: About the Map :: Landsat Lake Images
Landsat Satellite Image Gallery
of Wisconsin Lakes
| This image gallery provides examples of Landsat-5 and -7 imagery for a variety of sites in Wisconsin. All images were processed by Jon Chipman formerly of the University of Wisconsin Space Science & Engineering Center and WisconsinView. Please feel free to use these images, with credit to "UW SSEC and WisconsinView." Thanks for your interest in Landsat views of Wisconsin! Additional images of the Fond du Lac/southern Lake Winnebago area are available here in a separate image gallery. |
|
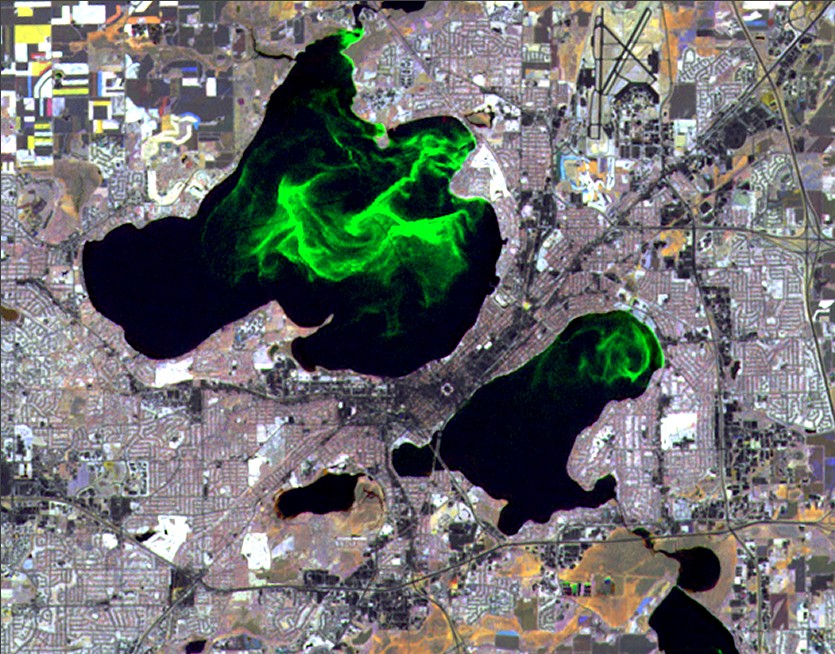
| This image of the Madison lakes was created using a variety of digital image processing techniques to enhance three separate Landsat-7 images from different dates in 1999-2000 and combine them into a single composite image. The results provide a dramatic view of an algal bloom that was occurring on Lakes Mendota and Monona in late October, 1999. | |
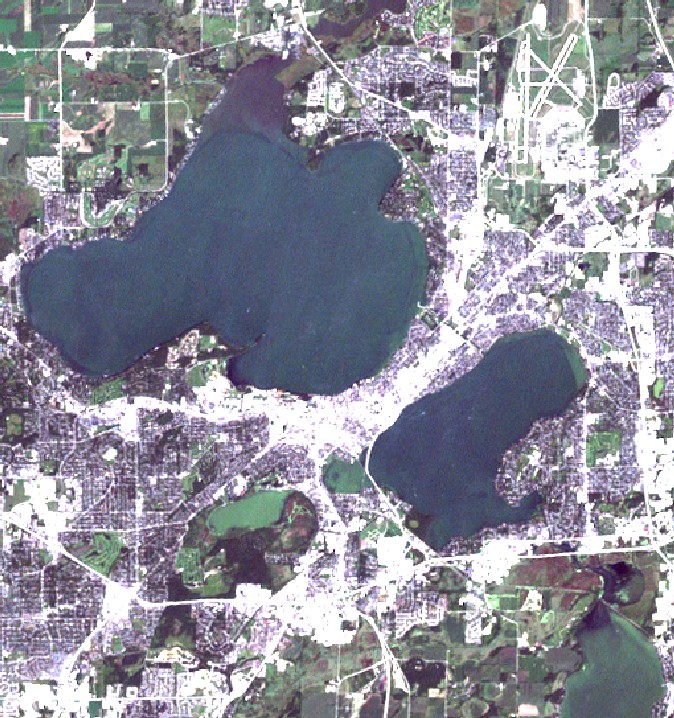
| This Landsat-7 image, acquired
on September 2, 2001, shows the Madison Lakes. Wisconsin's capital city
is located on the isthmus between Lake Mendota (top) and Lake Monona (right).
Smaller Lake Wingra (center) is surrounded by parks and by the forests
and wetlands of the UW Arboretum. At lower right, the Yahara River flows
out of Lake Monona and into Lake Waubesa. The differences in color within and among the Madison lakes result from variation in depth, water clarity, chlorophyll concentration, dissolved organic carbon, and other bio-optical factors. Differences in the numbers and species composition of algae give Lake Mendota and Lake Wingra quite different visual appearances in this Landsat image, with Lake Wingra having more of a green color. A more detailed discussion (with examples) of the use of satellite remote sensing to measure the optical properties of Lake Mendota and Lake Wingra is available here. |
|
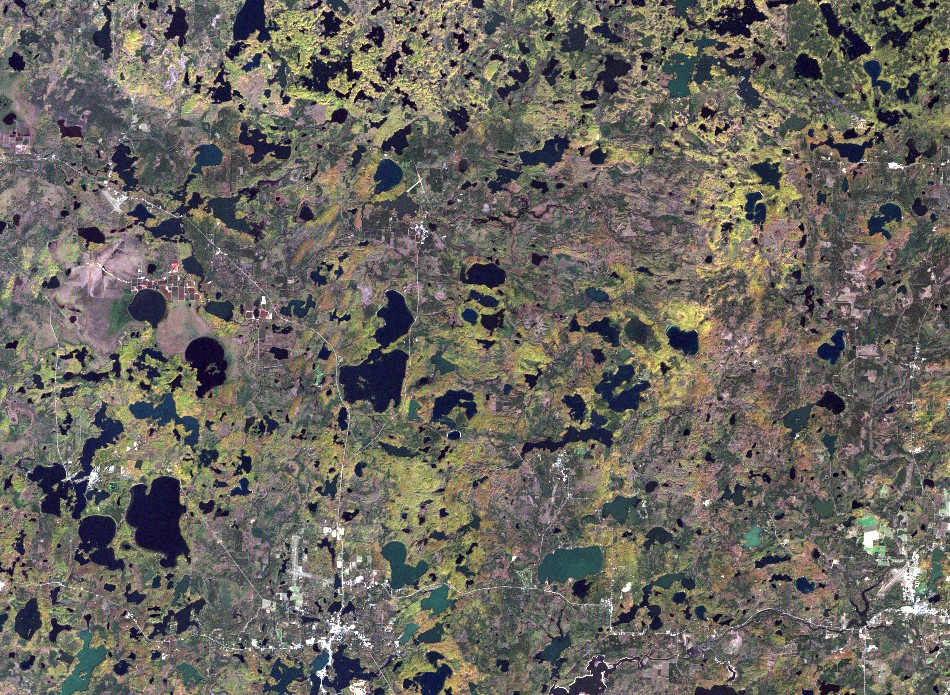
| This Landsat-7 image, acquired on October 6, 1999, shows a portion of the Northern Highlands lake district, centered on Vilas County. The communities of Minocqua and Woodruff are located at the center of the lower edge of this image, while Boulder Junction is in the upper center and Eagle River is at lower right. The Northern Highlands lake district has one of the highest densities of lakes in North America. Trout Lake - the largest lake in the center of this image - and six other nearby lakes are the focus of long-term studies of lake ecology by researchers at the UW Center for Limnology through the North Temperate Lakes Long-Term Ecological Research program. | |
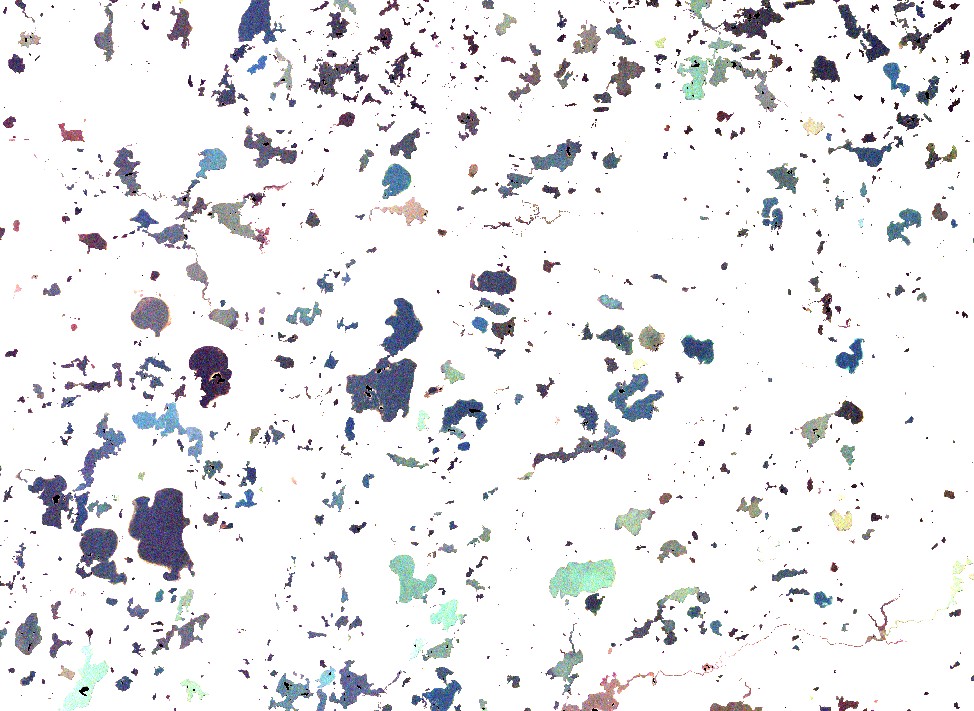
| This Landsat-7 image, acquired on October 6, 1999, shows a portion of the Northern Highlands lake district, centered on Vilas County. Digital image processing techniques have been used to "mask out" all land areas from this image, and to enhance the color variability among lakes. The result dramatically illustrates the differences among lakes, with each lake's color resulting from its own combination of water clarity, dissolved organic carbon, chlorophyll, and other factors. | |
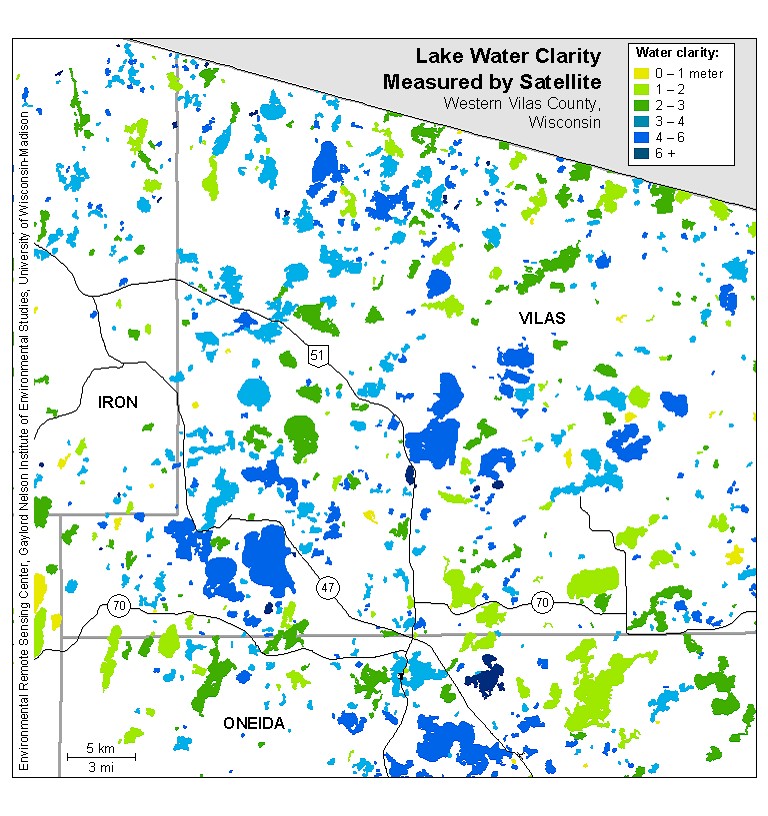
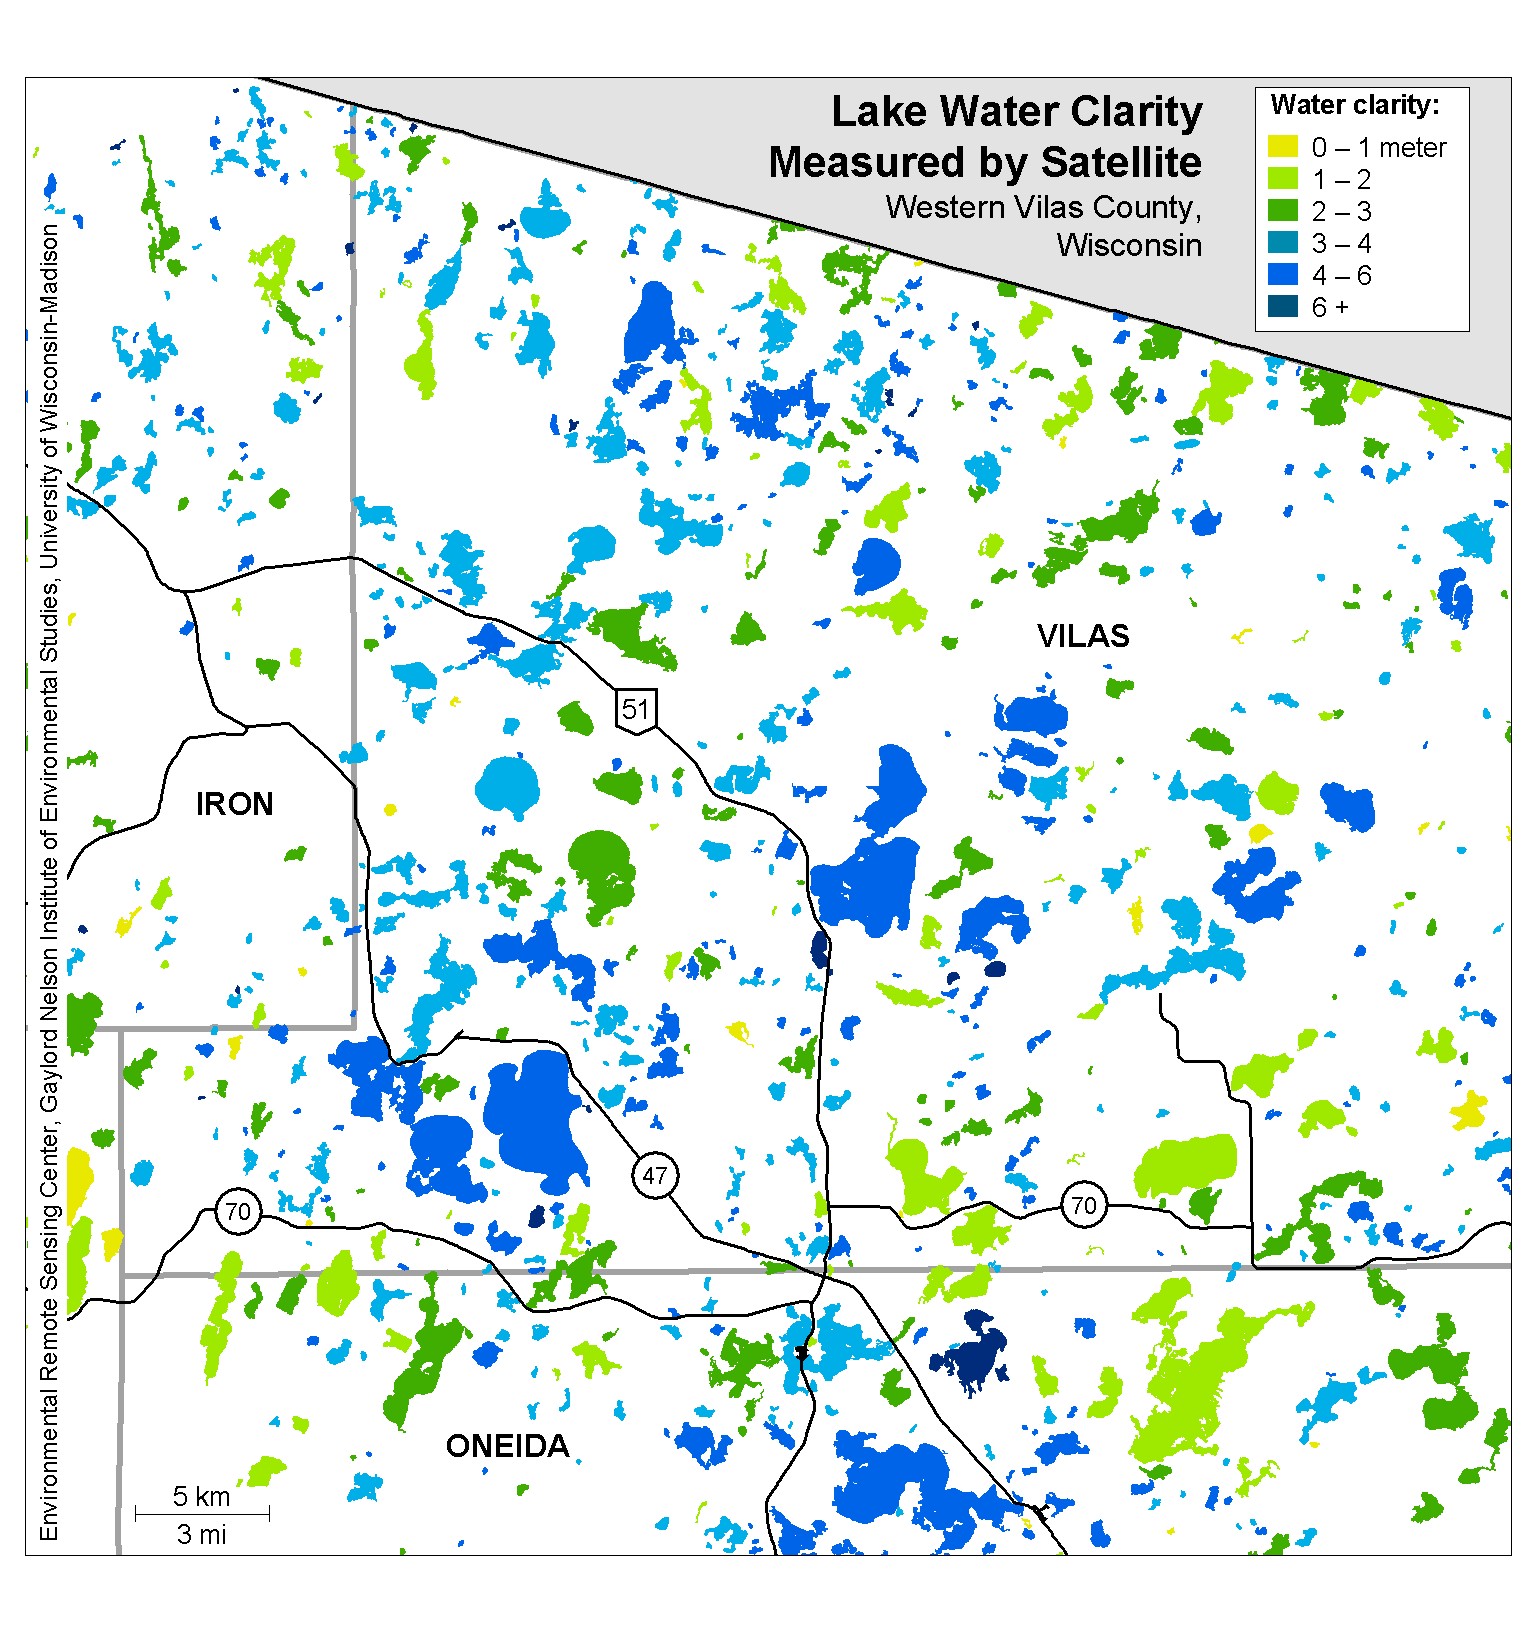
| This map of lake water clarity in western Vilas County shows a small portion of a statewide water clarity database for the 1999-2001 time period. The database includes multiple water clarity estimates for over 8,000 lakes, based on automated analysis of 17 Landsat-5 and Landsat-7 images. Analysis of the satellite data was assisted by hundreds of field observations conducted by a network of citizen volunteers coordinated through the Self-Help Citizens' Lake Monitoring Program at the Wisconsin Department of Natural Resources. More information about the Landsat lake water clarity project is available at https://lakesat.org. | |
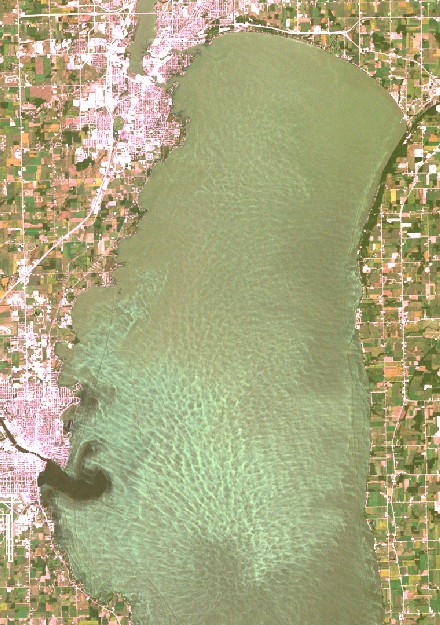
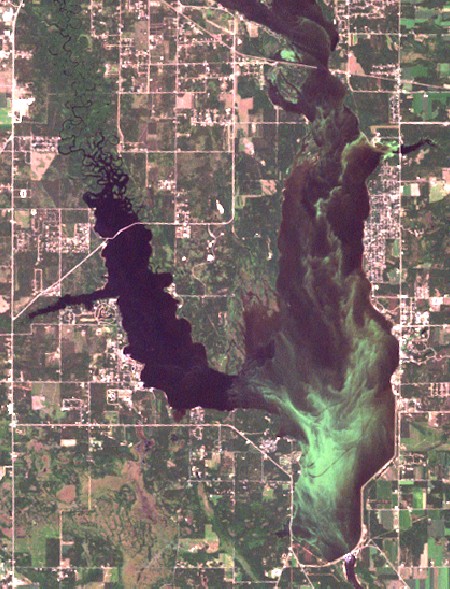
| This Landsat-7 image, acquired on September 8, 2000, shows a portion of Lake Winnebago, the largest lake in Wisconsin. A large algal bloom was occurring at the time this image was acquired. | |
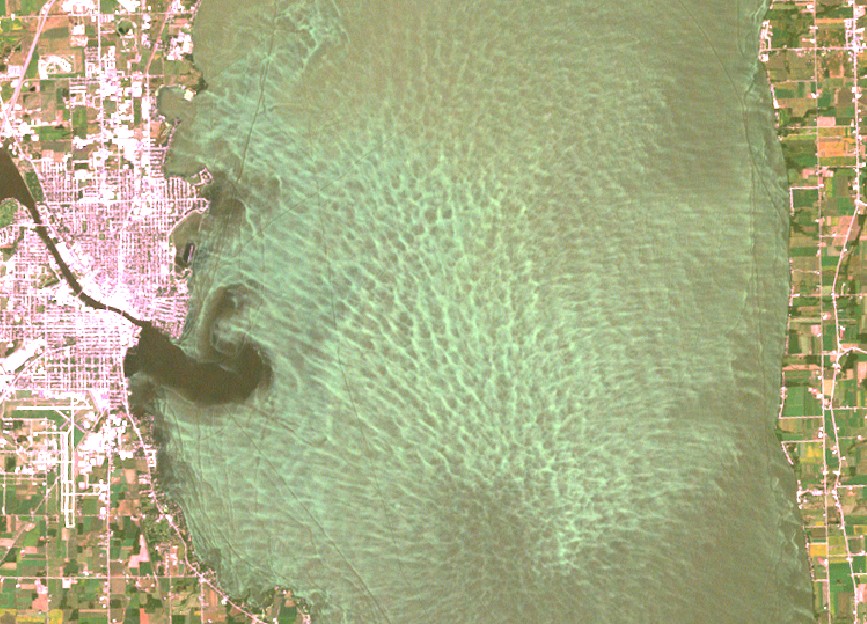
| This Landsat-7 image, acquired on September 8, 2000, shows an enlargement of the central portion of Lake Winnebago, the largest lake in Wisconsin. The complex spatial pattern visible on the lake surface is the result of wind action on the algae-laden waters of the lake. Note the plume of dark, relatively clear water at left, where the Fox River enters the lake. Many boat wakes can also be seen, some of which extend for several miles. | |
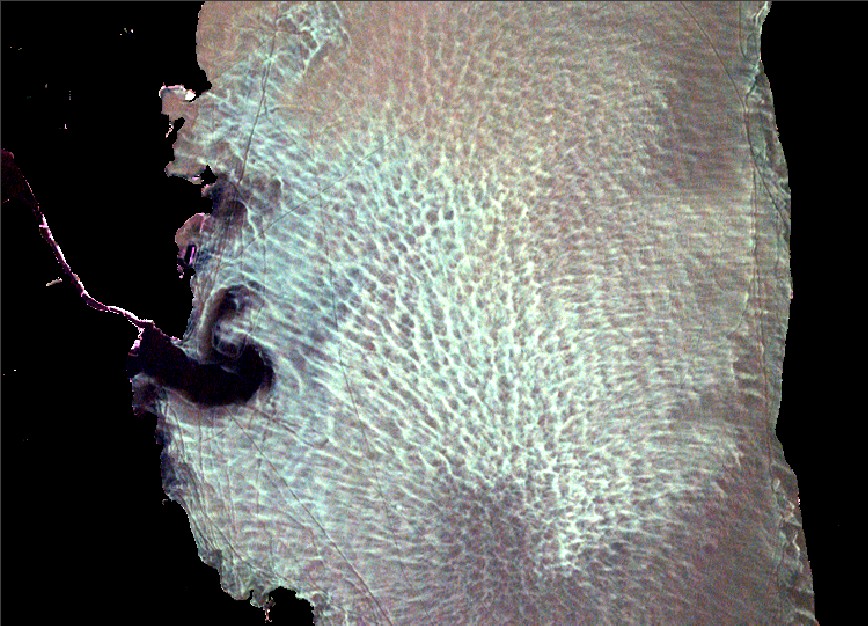
| This Landsat-7 image, acquired on September 8, 2000, shows an enlargement of the central portion of Lake Winnebago, the largest lake in Wisconsin. Digital image processing techniques have been used to "mask out" all land areas from this image, and to enhance the variability within Lake Winnebago associated with the complex spatial structure of the algal bloom that was occurring when the image was acquired. | |
| This Landsat-7 image, acquired on July 27, 1999, shows a large algal bloom occurring in Castle Rock Lake, a flowage on the Wisconsin River. | |
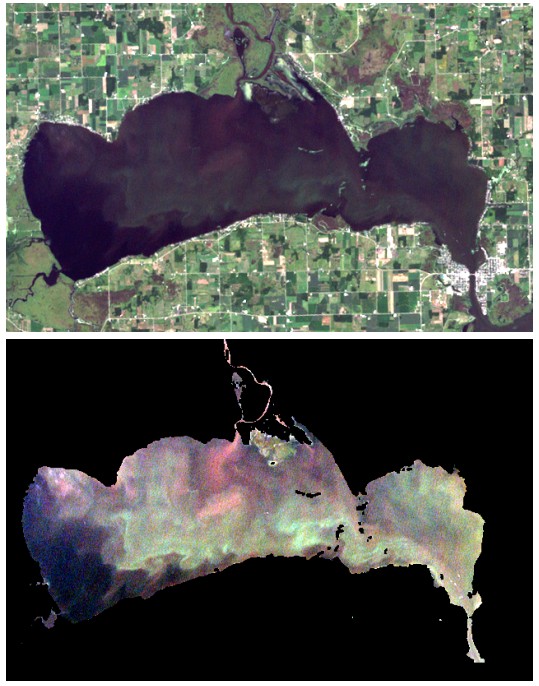
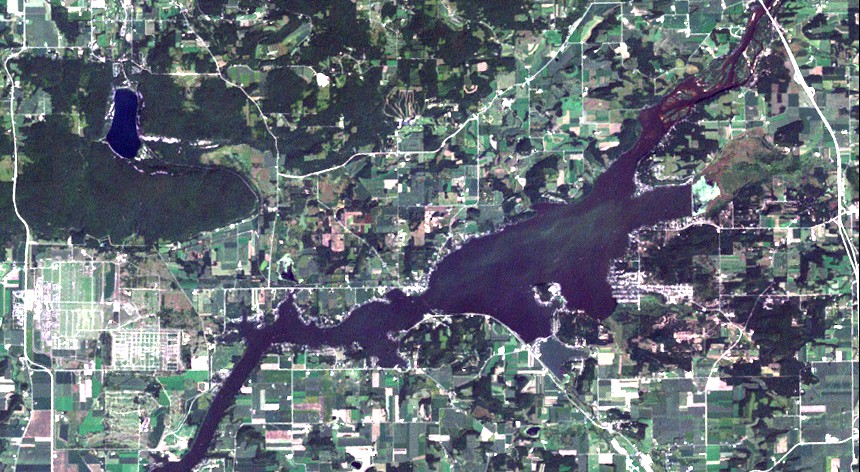
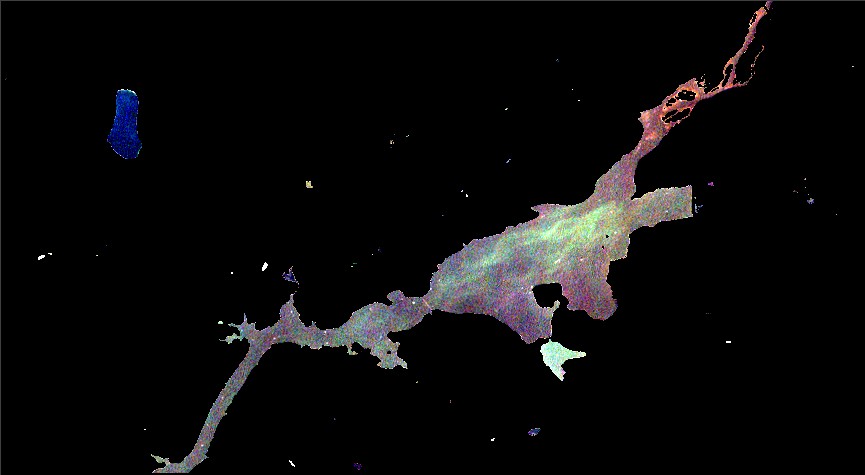
| This Landsat-7 image, acquired on July 27, 1999, shows Lakes Poygan and Winneconne. Two versions of the satellite imagery are compared. The first, "raw," image shows the lake in the context of its surrounding landscape. Extensive wetlands can be seen at the western and northern edges of Lake Poygan. In the second image, digital image processing techniques have been used to "mask out" all land areas, and to enhance the variability within the lakes. The results clearly show even the most subtle variations in lake color, with green colors representing the effects of chlorophyll-rich algae and red-brown colors representing suspended materials stirred up by wave action or carried into the lake from sources upstream. | |
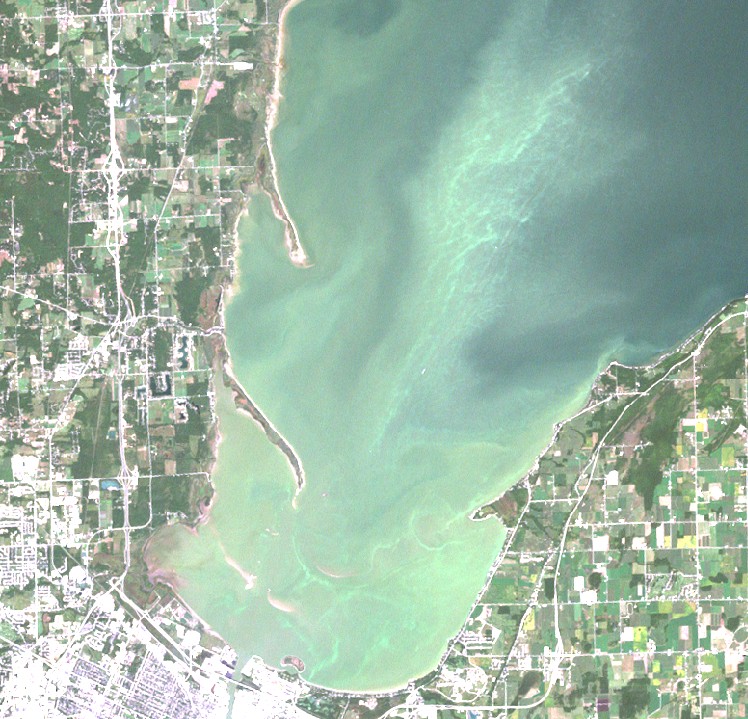
| This Landsat-7 image, acquired on September 8, 2000, shows the southern end of Green Bay, an arm of Lake Michigan and the largest estuary on the Great Lakes. Due to persistent water quality problems, Green Bay has been declared an Area of Concern by the International Joint Commission on the Great Lakes. | |
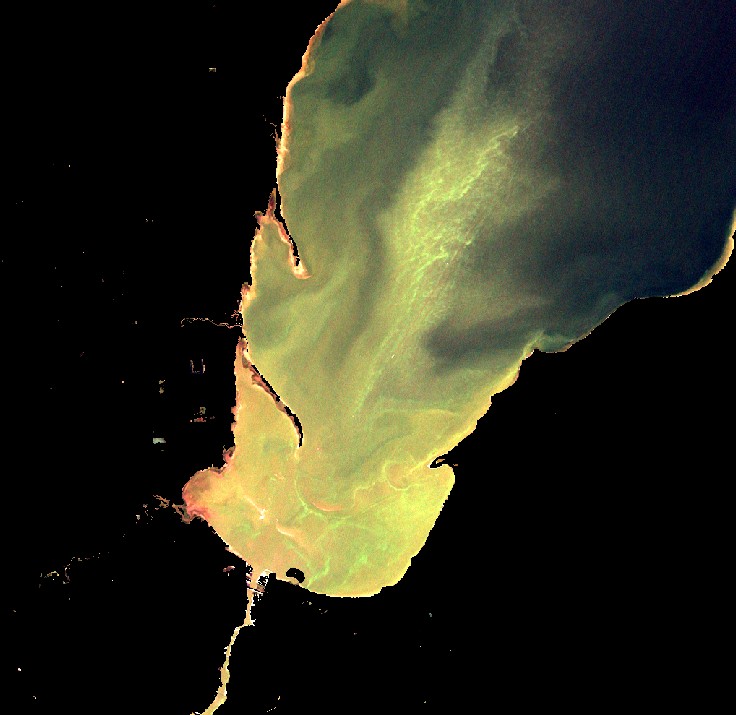
| This Landsat-7 image, acquired on September 8, 2000, shows the southern end of Green Bay, Lake Michigan. Digital image processing techniques have been used to "mask out" all land areas from this image, and to enhance the spatial variations in water clarity and turbidity within Green Bay. | |
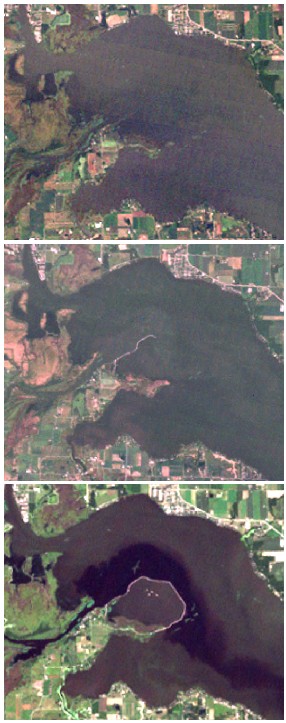
| These three Landsat images were acquired in 1991, 1994, and 1999. They document the construction of a massive "lakewall" enclosing approximately 220 hectares (550 acres) of open water and wetlands at Terrell's Island on the south shore of Lake Butte des Morts. The Butte des Morts Conservation Club is working to preserve wetlands and restore aquatic vegetation in the Terrell's Island area. The images were acquired by Landsat-5 on August 14, 1991 (top) and August 15, 1994 (middle), and Landsat-7 on July 27, 1999 (bottom). | |
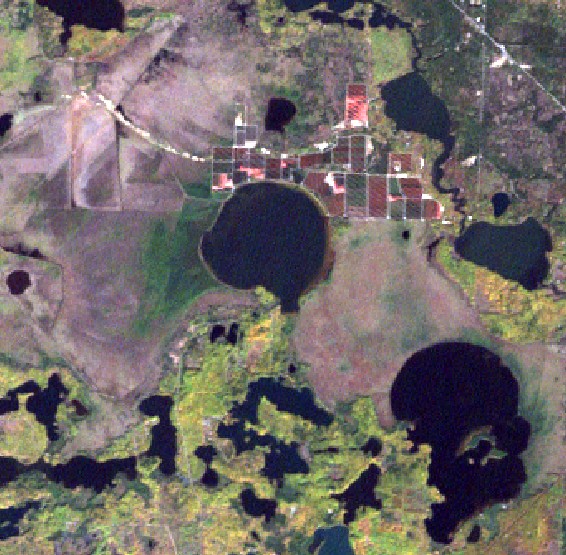
| This Landsat-7 image, acquired on October 6, 1999, shows
the area around Little Trout Lake (center), Ike Walton Lake (lower right),
and Powell Marsh. The rectangular features on the north shore of Little
Trout Lake are cultivated cranberry beds used for commercial cranberry production.
Cranberries are harvested in the early autumn, typically by flooding the
beds in which they are grown and causing the bright red berries to float
to the surface. Powell Marsh, surrounding the two lakes, is a vast peatland complex. The linear features in Powell Marsh west of Little Trout Lake are primarily caused by drainage ditches; these patterns illustrate the complex hydrology of the Powell Marsh wetlands. |
|
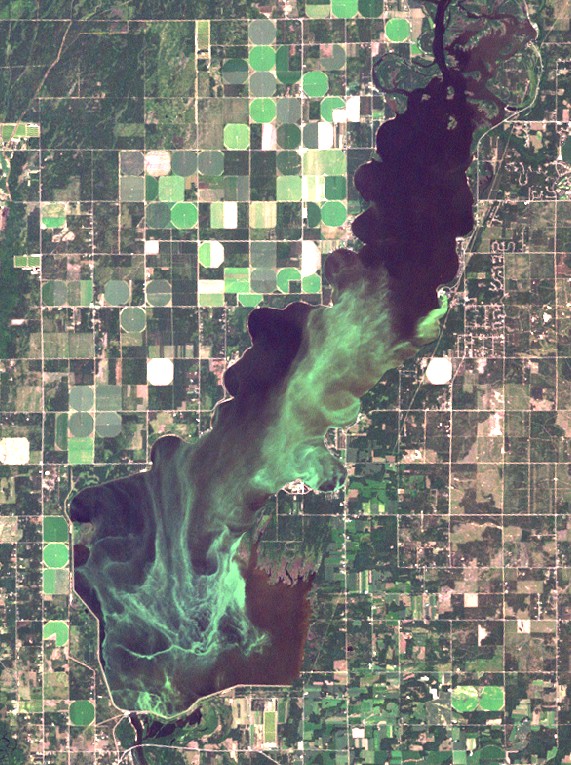
| This Landsat-7 image, acquired on July 27, 1999, shows a large algal bloom occurring in Petenwell Lake, a flowage on the Wisconsin River. Many center-pivot irrigation fields are located around Petenwell Lake, and can be seen as circular features in this image. | |
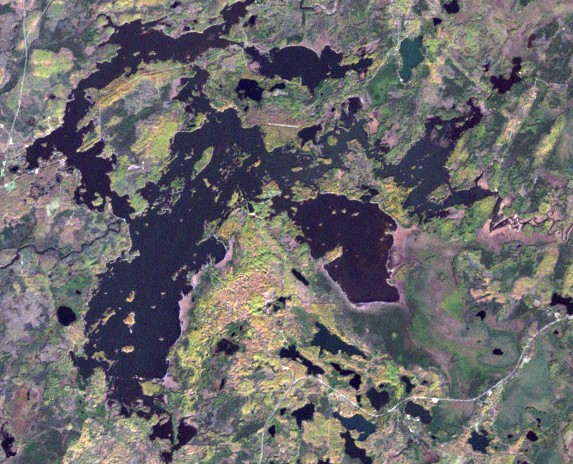
| This Landsat-7 image, acquired on October 6, 1999, shows the area around Turtle-Flambeau Flowage in Iron County. The flowage is notable for its vast extent, convoluted shoreline, and many islands, coves, and wetlands. A particularly extensive wetland complex is located to the east of the flowage, in the lower right quarter of this image. | |
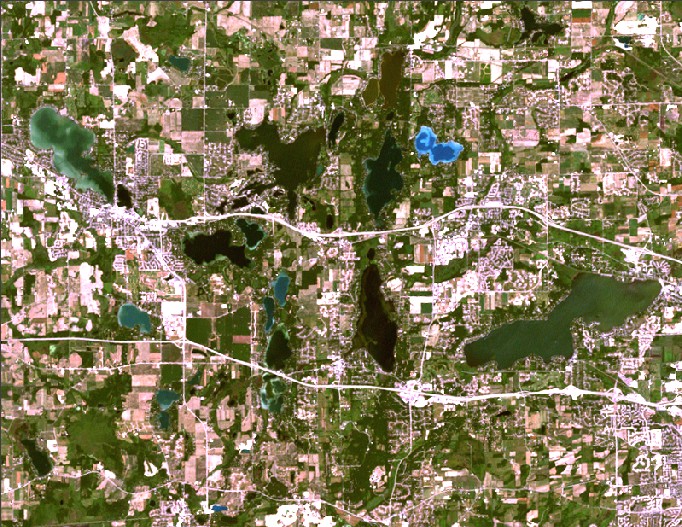
| This Landsat-7 image, acquired on July 9, 2001, shows a lake district in western Waukesha County. This lake district includes a number of quite different lakes in close proximity. The differences in color of the lakes in this image result from each lake's particular combination of water clarity, lake depth, chlorophyll concentration, dissolved organic carbon, and other factors. These factors in turn are impacted by the lake's position in the landscape, by its combination of water sources (ground water, surface water, and precipitation), by the types of land use present within the riparian zone, and by many other characteristics of the lake and its watershed. | |
| This Landsat-7 image, acquired on September 2, 2001, shows a portion of the Baraboo Hills region, including scenic Devil's Lake (upper left) and Lake Wisconsin (center, on the Wisconsin River). The forested Baraboo Hills appear dark green in color, in contrast to the lighter-toned agricultural fields of the surrounding area. | |
| This Landsat-7 image, acquired on September 2, 2001, shows scenic Devil's Lake in Sauk County (upper left) and Lake Wisconsin (center, on the Wisconsin River). Digital image processing techniques have been used to "mask out" all land areas from this image, and to enhance the spatial variations in water clarity in the two lakes. Devil's Lake (which appears deep blue in color in this image) is very clear, while Lake Wisconsin has much lower clarity. | |

