|
How to build a model of lake trophic state using satellite data |
This interactive page will show you how to build a regression model based on satellite observations of lakes and 'ground' samples of lakes to predict regional trophic state.
The data presented here are real data from the south-western part of Wisconsin. However, they come from existing data sets that were not designed for this type of analysis. We will build better and more complex models with the data collected each summer. But, in the meantime, these serve the purpose of demonstrating the methodology.
Follow the instructions bellow to go from data collecting to building the model to predicting trophic state.
![]() 1
1 ![]() Sampling the lakes on the 'ground'
Sampling the lakes on the 'ground'
The first step consists of collecting 'ground' data for selected lakes. This is the part where volunteers who participate in the self-help monitoring program participate. Depending on the lake, the lake is measured for several characteristics related to water clarity (or, strictly speaking, lake water optical properties). Measurements always include the Secchi disk depth, and may also include chlorophyll concentration, turbidity, and water color.
So, let take the boat into the Lake Keesus, for example, and measure water clarity with our Secchi disk.
Place your mouse pointer over the image below until the Secchi disk disappears from sight:

You have recorded the lake name, the date of the measurement, the Secchi depth, and other characteristics. All the data collected by all the volunteers are put together in the form of a table:
Now we are ready to extract data from the satellite image.
![]() 2
2 ![]() Sampling the lakes on the satellite image
Sampling the lakes on the satellite image
The image below shows an example of two full Landsat satellite scenes. These correspond to path 24/row 29, and path 24/row 30.
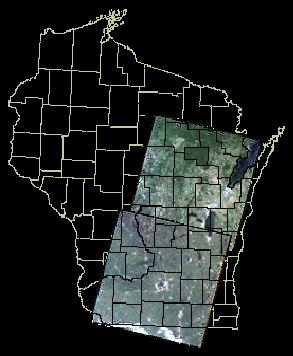
[click on the image to see a map of Landsat paths and rows for Wisconsin]
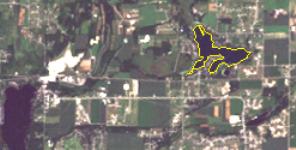
Now we need to extract data from each of the lakes. In this example, we are going to extract data for Lake Keesus, the same lake we sampled on the ground. Lake Keesus is the lake outlined in yellow in the image below.
Click on the lake to extract satellite data for Lake Keesus:
![]()
![]() 3
3 ![]() Building the regression model
Building the regression model
Now it is time to build a model to predict Secchi depth on all lakes in the satellite image. This is a statistical model that relates the observed Secchi depths measured on the lakes to a combination of spectral bands from the satellite image from the same lakes. For example, one may find that a good model to predict Secchi depth uses band 1 (blue light) and band 3 (red light):
Secchi depth (in feet) = function of (band 1, band 3)
Once the model is built, we can visualize how well it reproduces the observations using a plot like the one below. To build a plot like this, you use the model to predict Secchi depth on the same lakes that you used to build the model in the first place. Then, you display in a graph the values observed in the lake against the values predicted by the model. A perfect model would place all the observations (all the dots) along the 1:1 line. But there isn't such thing as a perfect model. So the dots will be scattered around the line of perfect prediction. The closer the dots are to the line, the better the model is performing.
Now, let's see how well we did with our data:
That isn't too bad, is it? The R2 below the equation in the upper-left corner is a statistical measure of the goodness-of-fit of our model. It ranges from 0 to 1, or from 0% to 100%. An R2 of zero would be the worst possible fit; an R2 of 100% would mean a perfect fit. A value of 88% is very good indeed!
![]() 4
4 ![]() Applying the regression model
Applying the regression model
Now we have reached the final stage. We are ready to apply the model. All we need to do is extract information for all lakes in the satellite image, and apply our equation to obtain a measure of Secchi disk.
In the example below, each dot within a lake has been colored according to the predicted Trophic State Index (TSI) on the lake at that location. The Trophic State Index is a measure of the degree to which a lake is eutrophic, that is, enriched in nutrients and therefore prone to algal blooms.
|
On the SLOI web |
|
| |
What is SLOI? |
| |
Self-Help Program |
| |
Building a model |
| |
Lakes from Space |
| On this page | |
| 1 | Sampling the lakes on the 'ground' |
| 2 | Sampling the lakes on the satellite image |
| 3 | Building the regression model |
| 4 | Applying the regression model |
18 April, 2003
Web layout: Joan Riera
[what is SLOI][self-help][build a model][lakes from space]